
On Tuesday morning after Labor Day Weekend, most operators look at rounds and revenue and compare them to last year to gauge how this season performed, and what's to come in the final stretch.
These three indicators, however, can tell you more about where your golf season is actually headed.
1. F&B and merch spend per golfer
Ancillary spend per round is the best signal you have for how the market is responding to your green fee pricing.
- If green fees are up a lot and per-golfer spend is down, you're bumping up against your customers' budgets.
- If green fees are up and per-golfer spend is flat or rising, you have room to grow.
Pull your ancillary spend for Labor Day Weekend and for the season to date for a measure of how your season is performing against historical data.
2. Inventory on hand + open orders
- Do you know how much inventory you have on hand?
- How much inventory is still on order?
- How much did you sell from this point to the end the season last year for comparison?
Combine these numbers and you will know exactly how much you need to liquidate so you're not caught carrying excess product through the winter months. You have four to six weeks to clear it...start now.
3. Your fall revenue forecast
- Do you know how revenue tracked last September and October?
- Do you know what outings are booked for the remainder of the year?
- And do you have a plan to fill daily-fee tee times around those outings?
There are 60 days left in the golf season. Identify you areas of opportunity to close this season out strong.

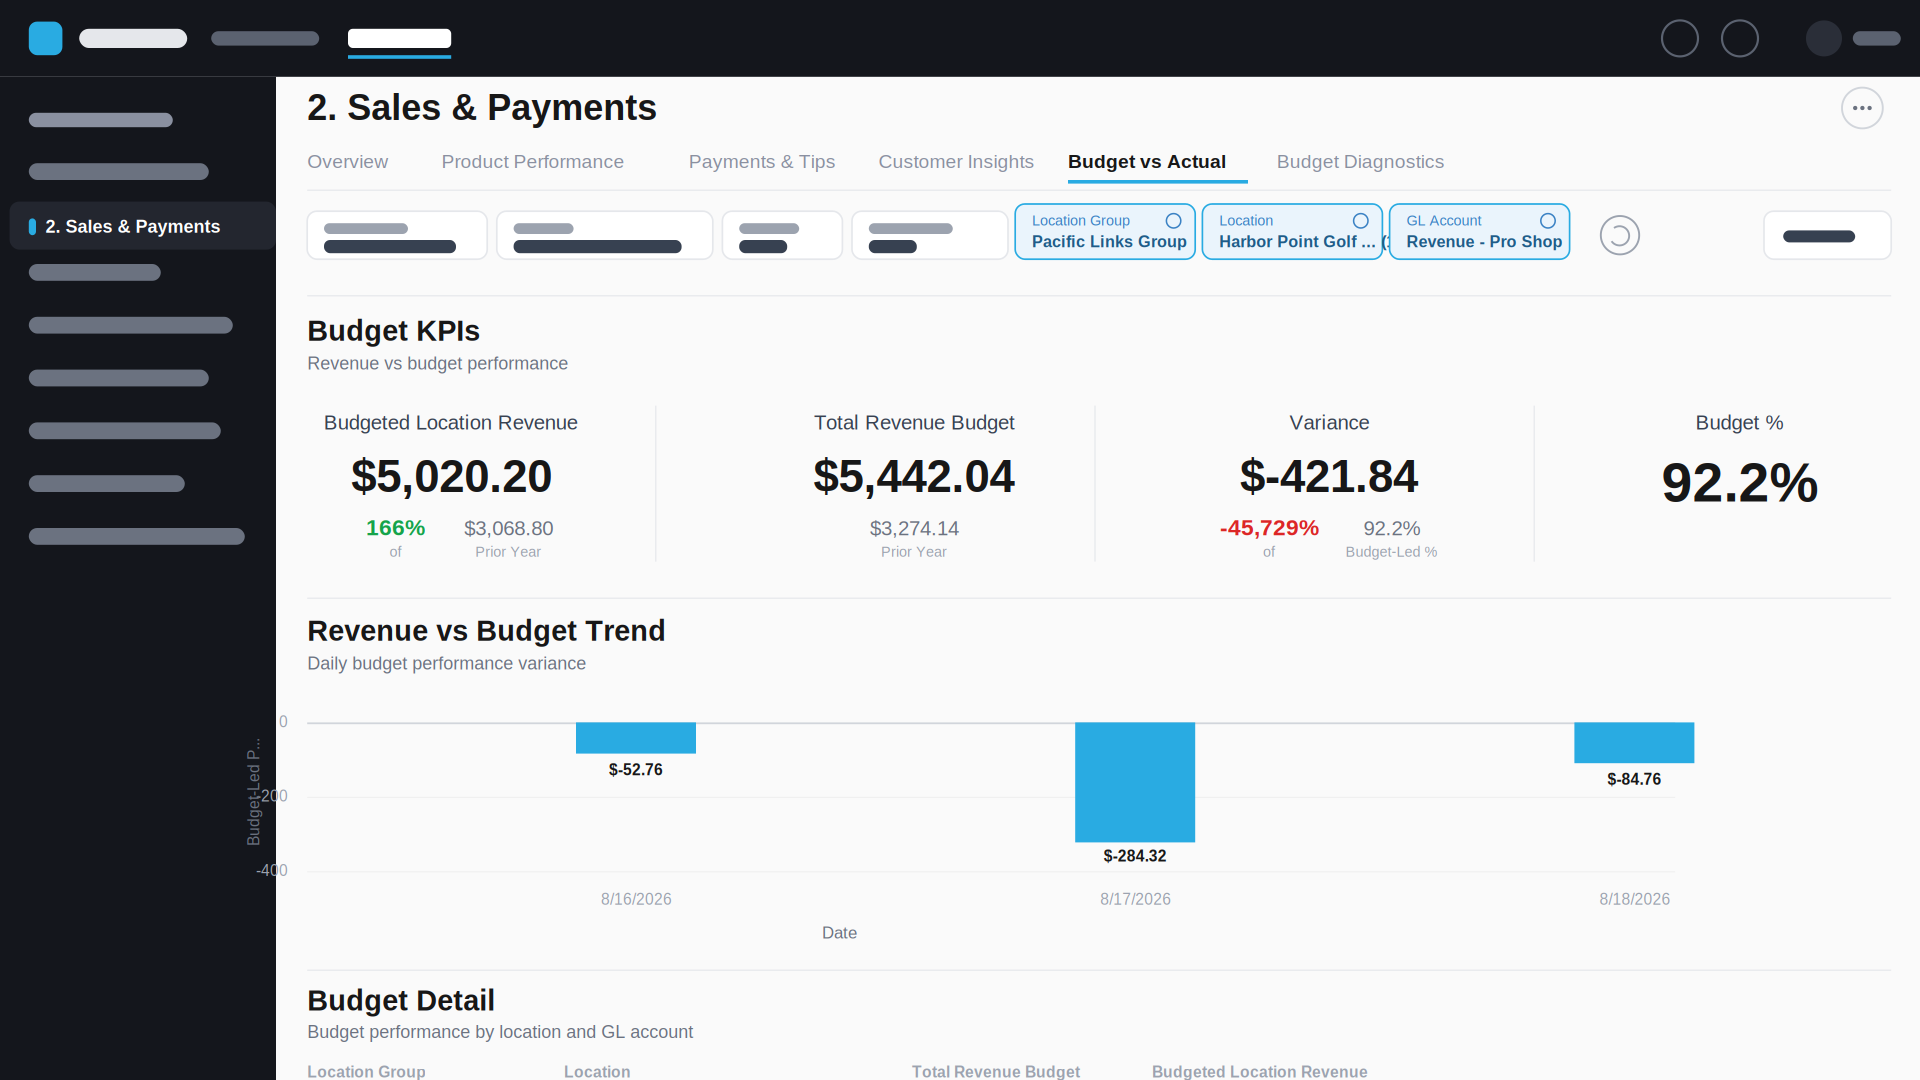
You already have these numbers. They're just scattered across three systems.
Noteefy Insights pulls tee sheet, POS, and marketing data into one view, so questions like these don't take a manual reconciliation to answer.